ndb1
$1.1M
Valeur des positions
$3.1M
Plus gros gain
3,067
Marchés tradés
- PnL total
- +$4.7M
- Volume total
- 155.2M
Profit/Perte
Jour Précédent

Will Manchester City win the 2026-27 English Premier League (EPL) Championship?
70.7¢
93.5¢
Will Manchester City win the 2026-27 English Premier League (EPL) Championship?

Bitcoin all time high by December 31, 2026?
85.7¢
98.4¢
Bitcoin all time high by December 31, 2026?
Will Bitcoin hit $150k by December 31, 2026?
90.4¢
99¢
Will Bitcoin hit $150k by December 31, 2026?

Will Barcelona win the 2026-27 UEFA Champions League Championship?
78.4¢
76.5¢
Will Barcelona win the 2026-27 UEFA Champions League Championship?

Will Barcelona win the 2026-27 LALIGA Championship?
68¢
70.5¢
Will Barcelona win the 2026-27 LALIGA Championship?
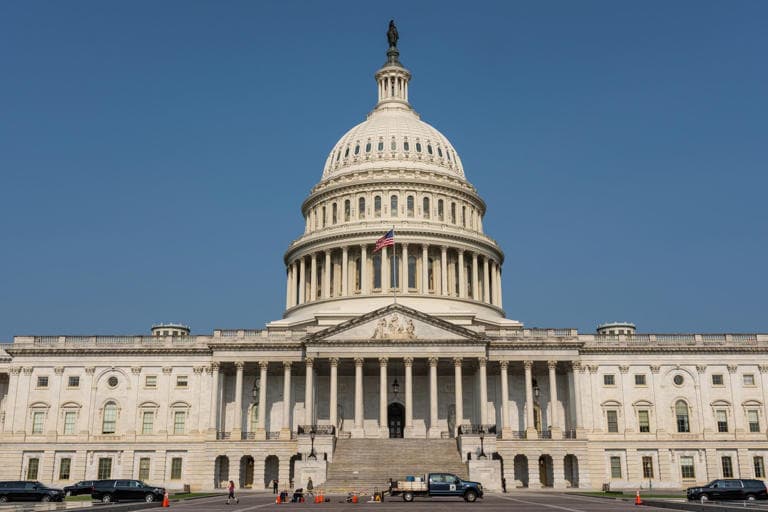
Clarity Act (H.R.3633) signed into law in 2026?
76.3¢
98.3¢
Clarity Act (H.R.3633) signed into law in 2026?
Will Bitcoin reach $160,000 by December 31, 2026?
94.5¢
99.5¢
Will Bitcoin reach $160,000 by December 31, 2026?
Will Bitcoin reach $200,000 by December 31, 2026?
96.6¢
99.7¢
Will Bitcoin reach $200,000 by December 31, 2026?
Will Bitcoin reach $190,000 by December 31, 2026?
96.5¢
99.6¢
Will Bitcoin reach $190,000 by December 31, 2026?
Will Bitcoin reach $140,000 by December 31, 2026?
96.1¢
99.1¢
Will Bitcoin reach $140,000 by December 31, 2026?
Will Bitcoin reach $180,000 by December 31, 2026?
96.6¢
99.6¢
Will Bitcoin reach $180,000 by December 31, 2026?

Will the Democrats win the 2028 US Presidential Election?
31.8¢
32.5¢
Will the Democrats win the 2028 US Presidential Election?
Will Bitcoin reach $170,000 by December 31, 2026?
95.2¢
99.6¢
Will Bitcoin reach $170,000 by December 31, 2026?

Will Eddie Howe be the next head coach of the England national team?
90.4¢
98.8¢
Will Eddie Howe be the next head coach of the England national team?
Will Bitcoin reach $250,000 by December 31, 2026?
98¢
99.9¢
Will Bitcoin reach $250,000 by December 31, 2026?
Will Arsenal win the 2026-27 English Premier League (EPL) Championship?
46.1¢
75.5¢
Will Arsenal win the 2026-27 English Premier League (EPL) Championship?

Will the Los Angeles Chargers make the 2027 NFL Playoffs?
35¢
98.6¢
Will the Los Angeles Chargers make the 2027 NFL Playoffs?

Will Hull City be relegated from the 2026-27 Premier League?
52.5¢
56.5¢
Will Hull City be relegated from the 2026-27 Premier League?
Will the Washington Commanders make the 2027 NFL Playoffs?
69¢
81¢
Will the Washington Commanders make the 2027 NFL Playoffs?
64¢
60.5¢
