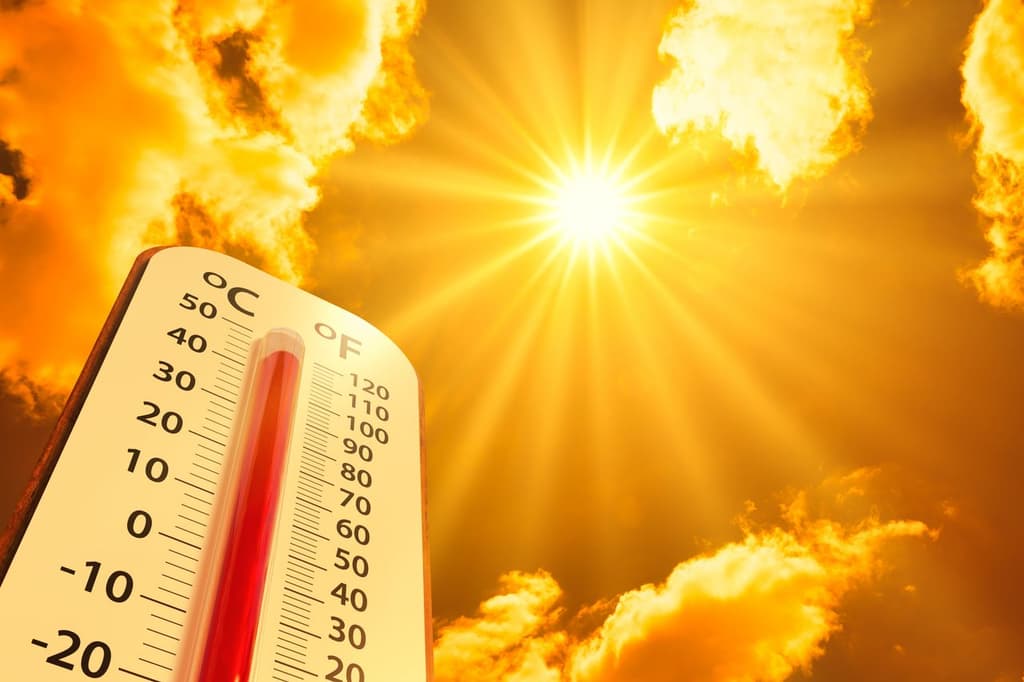
A strong El Niño event is rapidly intensifying in the equatorial Pacific, with Niño 3.4 sea surface temperature anomalies already exceeding +2°C in August 2026 and multi-model forecasts pointing to 2.9–3.4°C by September–October. This adds substantial warmth atop the long-term anthropogenic trend of roughly 0.27°C per decade, pushing September 2026 global mean surface temperatures well above recent baselines. However, the full global temperature response typically lags peak ENSO conditions by three to five months, introducing uncertainty in the exact September anomaly across datasets. Recent record daily sea surface temperatures and August 2026 warmth near or above prior monthly peaks further elevate expectations, while model spread and internal variability keep outcomes closely balanced around 1.3–1.5°C above pre-industrial levels.
Ringkasan eksperimental yang dihasilkan AI dengan referensi data Polymarket. Ini bukan saran trading dan tidak berperan dalam bagaimana pasar ini diselesaikan. · DiperbaruiSeptember 2026 Temperature Increase (ºC)
September 2026 Temperature Increase (ºC)
<1.30ºC 50%
1.30–1.34ºC 50%
1.35–1.39ºC 50%
1.40–1.44ºC 50%
<1.30ºC
50%
1.30–1.34ºC
50%
1.35–1.39ºC
50%
1.40–1.44ºC
50%
1.45–1.49ºC
50%
>1.49ºC
50%
<1.30ºC 50%
1.30–1.34ºC 50%
1.35–1.39ºC 50%
1.40–1.44ºC 50%
<1.30ºC
50%
1.30–1.34ºC
50%
1.35–1.39ºC
50%
1.40–1.44ºC
50%
1.45–1.49ºC
50%
>1.49ºC
50%
An anomaly within a named bracket for September 2026 is necessary and sufficient to resolve this market immediately once the data becomes available, regardless of whether the figure for September 2026 is later revised.
The brackets are mutually exclusive and collectively exhaustive: each range is inclusive of both of its stated endpoints, and the reported anomaly (to the nearest 0.01ºC) falls within exactly one bracket.
The primary resolution source for this market will be the figure found in the table titled "GLOBAL Land-Ocean Temperature Index in 0.01 degrees Celsius" under the column "Sep" in the row "2026" (https://data.giss.nasa.gov/gistemp/tabledata_v4/GLB.Ts+dSST.txt).
If NASA's "Global Temperature Index" is rendered permanently unavailable, other information from NASA may be used.
If no information for September 2026 is provided by NASA by November 1, 2026, 11:59 PM ET, this market will resolve to the lowest range bracket.
Pasar Dibuka: Aug 31, 2026, 9:36 AM ET
Resolver
0x69c47De9D...An anomaly within a named bracket for September 2026 is necessary and sufficient to resolve this market immediately once the data becomes available, regardless of whether the figure for September 2026 is later revised.
The brackets are mutually exclusive and collectively exhaustive: each range is inclusive of both of its stated endpoints, and the reported anomaly (to the nearest 0.01ºC) falls within exactly one bracket.
The primary resolution source for this market will be the figure found in the table titled "GLOBAL Land-Ocean Temperature Index in 0.01 degrees Celsius" under the column "Sep" in the row "2026" (https://data.giss.nasa.gov/gistemp/tabledata_v4/GLB.Ts+dSST.txt).
If NASA's "Global Temperature Index" is rendered permanently unavailable, other information from NASA may be used.
If no information for September 2026 is provided by NASA by November 1, 2026, 11:59 PM ET, this market will resolve to the lowest range bracket.
Resolver
0x69c47De9D...A strong El Niño event is rapidly intensifying in the equatorial Pacific, with Niño 3.4 sea surface temperature anomalies already exceeding +2°C in August 2026 and multi-model forecasts pointing to 2.9–3.4°C by September–October. This adds substantial warmth atop the long-term anthropogenic trend of roughly 0.27°C per decade, pushing September 2026 global mean surface temperatures well above recent baselines. However, the full global temperature response typically lags peak ENSO conditions by three to five months, introducing uncertainty in the exact September anomaly across datasets. Recent record daily sea surface temperatures and August 2026 warmth near or above prior monthly peaks further elevate expectations, while model spread and internal variability keep outcomes closely balanced around 1.3–1.5°C above pre-industrial levels.
Ringkasan eksperimental yang dihasilkan AI dengan referensi data Polymarket. Ini bukan saran trading dan tidak berperan dalam bagaimana pasar ini diselesaikan. · Diperbarui
Hati-hati dengan link eksternal.
Hati-hati dengan link eksternal.
Pertanyaan yang Sering Diajukan