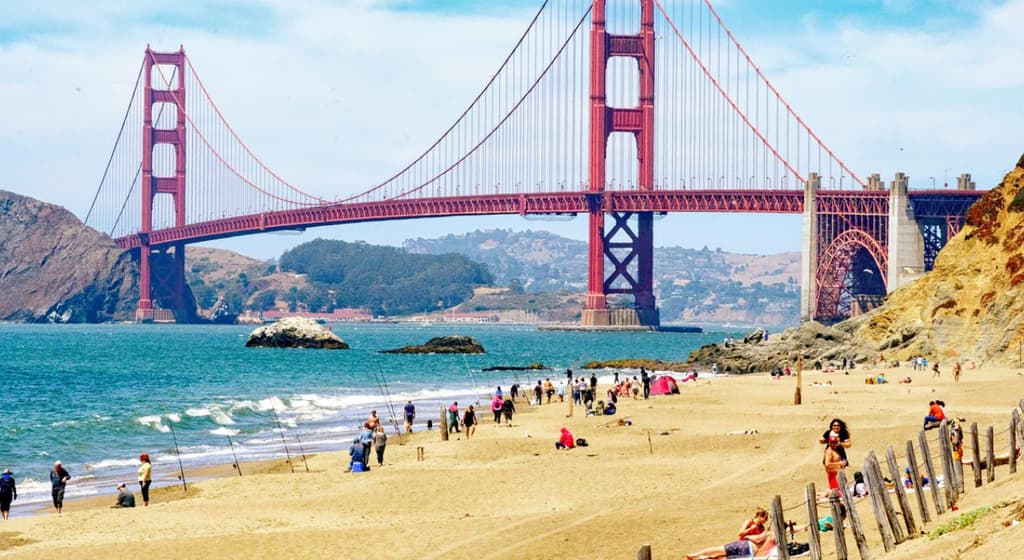
Marine layer depth and onshore flow from the Pacific represent the dominant controls on San Francisco’s August 21 maximum temperature, with National Weather Service guidance showing a persistent stratus deck that typically limits afternoon warming to the upper 60s. Subtle differences between the 68–69°F and 70–71°F brackets hinge on the precise timing of any marine-layer thinning or burn-off, wind speeds through the Golden Gate, and modest warming aloft—all factors that current models resolve with only modest consensus. Long-term August averages near 67–68°F anchor trader sentiment, while the narrow spread across leading outcomes reflects genuine forecast uncertainty rather than any recent anomalous heat or cold-air outbreak. Updated model runs and morning soundings will provide the next clearest signals for resolution.
Polymarketデータを参照したAI生成の実験的な要約。これは取引アドバイスではなく、このマーケットの解決方法には一切関係ありません。 · 更新日8月21日のサンフランシスコの最高気温は?
8月21日のサンフランシスコの最高気温は?
68〜69°F 29%
70~71°F 29%
66〜67°F 14%
64~65°F 10%
華氏61度以下
1%
62~63°F
2%
64~65°F
10%
66〜67°F
14%
68〜69°F
29%
70~71°F
29%
72~73°F
9%
74〜75°F
5%
76〜77°F
1%
78〜79°F
1%
華氏80度以上
<1%
68〜69°F 29%
70~71°F 29%
66〜67°F 14%
64~65°F 10%
華氏61度以下
1%
62~63°F
2%
64~65°F
10%
66〜67°F
14%
68〜69°F
29%
70~71°F
29%
72~73°F
9%
74〜75°F
5%
76〜77°F
1%
78〜79°F
1%
華氏80度以上
<1%
This market will resolve to the temperature range that contains the highest temperature recorded at the San Francisco International Airport Station in degrees Fahrenheit on 21 Aug '26.
The resolution source for this market will be information from Wunderground, specifically the highest temperature recorded for all times on this day for the San Francisco International Airport Station, available here: https://www.wunderground.com/history/daily/us/ca/san-francisco/KSFO.
To toggle between Fahrenheit and Celsius, click the gear icon next to the search bar and switch the Temperature setting between °F and °C.
This market can not resolve until the first data point for the following date has been published on the resolution source.
The resolution source for this market measures temperatures to whole degrees Fahrenheit (eg, 21°F). Thus, this is the level of precision that will be used when resolving the market.
Revisions to temperatures recorded within this market's timeframe will be considered until the first datapoint for the following date has been published, after which any alterations will not be considered.
マーケット開始日: Aug 19, 2026, 9:57 PM ET
This market will resolve to the temperature range that contains the highest temperature recorded at the San Francisco International Airport Station in degrees Fahrenheit on 21 Aug '26.
The resolution source for this market will be information from Wunderground, specifically the highest temperature recorded for all times on this day for the San Francisco International Airport Station, available here: https://www.wunderground.com/history/daily/us/ca/san-francisco/KSFO.
To toggle between Fahrenheit and Celsius, click the gear icon next to the search bar and switch the Temperature setting between °F and °C.
This market can not resolve until the first data point for the following date has been published on the resolution source.
The resolution source for this market measures temperatures to whole degrees Fahrenheit (eg, 21°F). Thus, this is the level of precision that will be used when resolving the market.
Revisions to temperatures recorded within this market's timeframe will be considered until the first datapoint for the following date has been published, after which any alterations will not be considered.
Marine layer depth and onshore flow from the Pacific represent the dominant controls on San Francisco’s August 21 maximum temperature, with National Weather Service guidance showing a persistent stratus deck that typically limits afternoon warming to the upper 60s. Subtle differences between the 68–69°F and 70–71°F brackets hinge on the precise timing of any marine-layer thinning or burn-off, wind speeds through the Golden Gate, and modest warming aloft—all factors that current models resolve with only modest consensus. Long-term August averages near 67–68°F anchor trader sentiment, while the narrow spread across leading outcomes reflects genuine forecast uncertainty rather than any recent anomalous heat or cold-air outbreak. Updated model runs and morning soundings will provide the next clearest signals for resolution.
Polymarketデータを参照したAI生成の実験的な要約。これは取引アドバイスではなく、このマーケットの解決方法には一切関係ありません。 · 更新日
外部リンクに注意してください。
外部リンクに注意してください。
よくある質問