A cold front advancing across the central and eastern United States on August 20, 2026, served as the dominant driver of trader positioning, interacting with abundant Gulf moisture to trigger widespread showers and thunderstorms, especially across the Ohio Valley and Midwest where the Weather Prediction Center noted excessive rainfall and flooding risks. Official National Weather Service observations highlighted heavy precipitation bands from Nebraska through Iowa, Illinois, Indiana, Ohio, and into West Virginia, consistent with mesoscale convective systems typical ahead of such fronts. In the Southwest, monsoon moisture supported isolated afternoon thunderstorms in western Arizona. NOAA’s Quantitative Precipitation Forecast products and surface analyses provided the key data thresholds for resolution, with post-event verification from NWS offices and the Climate Prediction Center’s precipitation maps expected to confirm totals within days. Traders weighed model consensus on frontal timing and intensity against historical August climatology for these regions.
Ringkasan eksperimental yang dihasilkan AI dengan referensi data Polymarket. Ini bukan saran trading dan tidak berperan dalam bagaimana pasar ini diselesaikan. · DiperbaruiWhere will it rain on August 20?
Where will it rain on August 20?

New York, NY
54%

Los Angeles, CA
50%

Chicago, IL
50%

Houston, TX
50%

Dallas, TX
50%

Phoenix, AZ
50%
Philadelphia, PA
50%

Denver, CO
50%
Washington, DC
50%

Atlanta, GA
50%
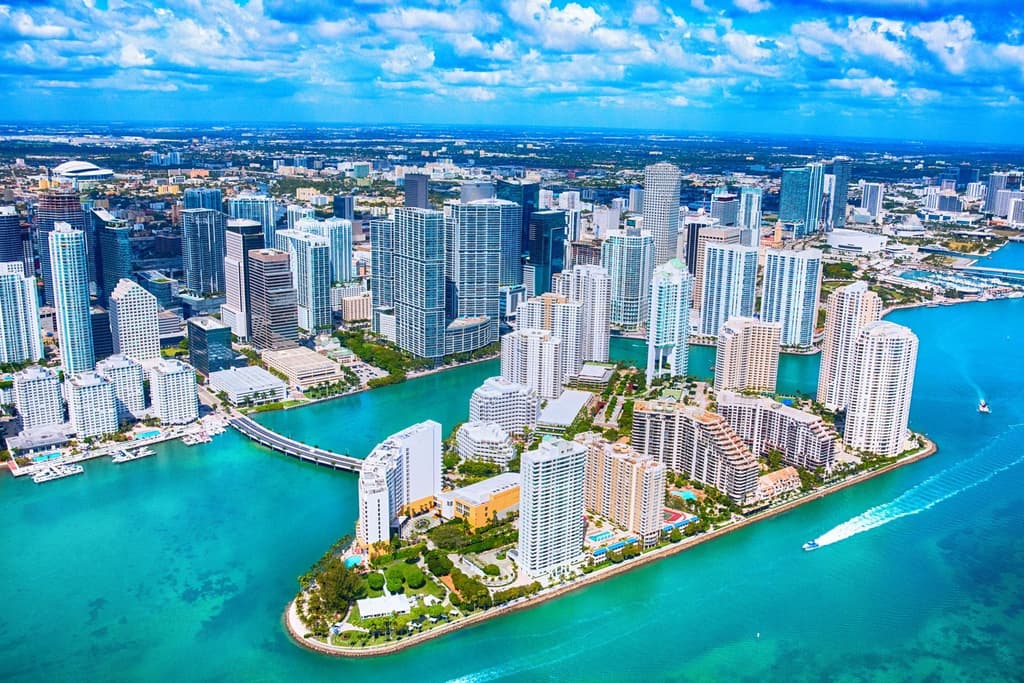
Miami, FL
50%

Seattle, WA
50%
Boston, MA
50%
New Orleans, LA
50%

San Francisco, CA
50%
$79 Vol.
New York, NY
54%
Los Angeles, CA
50%
Chicago, IL
50%
Houston, TX
50%
Dallas, TX
50%
Phoenix, AZ
50%
Philadelphia, PA
50%
Denver, CO
50%
Washington, DC
50%
Atlanta, GA
50%
Miami, FL
50%
Seattle, WA
50%
Boston, MA
50%
New Orleans, LA
50%
San Francisco, CA
50%
Measurable precipitation means 0.01 inches or more as reported by the PRECIPITATION (IN) figure in the NWS Daily Climate Report (CLI) for the city's station.
A report of trace ("T") does not qualify.
The PRECIPITATION (IN) figure measures total liquid-equivalent precipitation and does not distinguish between precipitation types.
The observation period is the NWS climate day for KNYC: midnight to midnight local standard time. The final CLI report for a climate day is issued the following morning.
Resolution is based on the station's first published precipitation figure for the day. Subsequent revisions or corrections to the published data will not be considered; the first published value is final. If no figure has been published by 11:59 PM ET on the day following the observation date, this market will resolve to "No".
The resolution source for this market is the NWS Daily Climate Report (CLI) for KNYC.
Pasar Dibuka: Aug 20, 2026, 7:09 AM ET
Measurable precipitation means 0.01 inches or more as reported by the PRECIPITATION (IN) figure in the NWS Daily Climate Report (CLI) for the city's station.
A report of trace ("T") does not qualify.
The PRECIPITATION (IN) figure measures total liquid-equivalent precipitation and does not distinguish between precipitation types.
The observation period is the NWS climate day for KNYC: midnight to midnight local standard time. The final CLI report for a climate day is issued the following morning.
Resolution is based on the station's first published precipitation figure for the day. Subsequent revisions or corrections to the published data will not be considered; the first published value is final. If no figure has been published by 11:59 PM ET on the day following the observation date, this market will resolve to "No".
The resolution source for this market is the NWS Daily Climate Report (CLI) for KNYC.
A cold front advancing across the central and eastern United States on August 20, 2026, served as the dominant driver of trader positioning, interacting with abundant Gulf moisture to trigger widespread showers and thunderstorms, especially across the Ohio Valley and Midwest where the Weather Prediction Center noted excessive rainfall and flooding risks. Official National Weather Service observations highlighted heavy precipitation bands from Nebraska through Iowa, Illinois, Indiana, Ohio, and into West Virginia, consistent with mesoscale convective systems typical ahead of such fronts. In the Southwest, monsoon moisture supported isolated afternoon thunderstorms in western Arizona. NOAA’s Quantitative Precipitation Forecast products and surface analyses provided the key data thresholds for resolution, with post-event verification from NWS offices and the Climate Prediction Center’s precipitation maps expected to confirm totals within days. Traders weighed model consensus on frontal timing and intensity against historical August climatology for these regions.
Ringkasan eksperimental yang dihasilkan AI dengan referensi data Polymarket. Ini bukan saran trading dan tidak berperan dalam bagaimana pasar ini diselesaikan. · Diperbarui
Hati-hati dengan link eksternal.
Hati-hati dengan link eksternal.
Pertanyaan yang Sering Diajukan