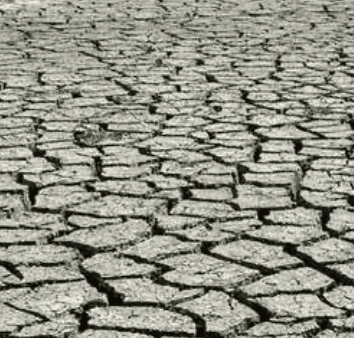
Recent U.S. Drought Monitor data valid September 1, 2026, show exceptional (D4) drought covering about 1.4% of the contiguous United States, concentrated in Texas (2.6% of state area) and expanding across parts of the Northwest, including southern Idaho and eastern Oregon. Degradations over the past week in the Southern Plains and Upper Midwest, driven by persistent dryness and below-normal precipitation, have supported these conditions, while scattered improvements occurred elsewhere. El Niño influences and seasonal outlooks favor continued drought persistence in affected regions through fall. The next USDM map, released September 10 and valid around September 8, along with the updated Seasonal Drought Outlook on September 17, will provide key data for resolution, with model consensus on steering patterns and rainfall deficits as primary variables.
Resumen experimental generado por IA con datos de Polymarket. Esto no es asesoramiento de trading y no influye en cómo se resuelve este mercado. · ActualizadoSequía excepcional (D4) por estado — semana del 8 de septiembre de 2026
Sequía excepcional (D4) por estado — semana del 8 de septiembre de 2026
Alabama
4%
Arizona
4%
Arkansas
96%
California
5%
Colorado
87%
Delaware
4%
Florida
25%
Georgia
50%
Idaho
96%
Illinois
4%
Indiana
5%
Iowa
5%
Kansas
5%
Kentucky
5%
Luisiana
6%
Maryland
26%
Minnesota
50%
Misisipi
94%
Missouri
26%
Montana
50%
Nebraska
94%
Nevada
95%
Nueva Jersey
46%
Nuevo México
95%
Carolina del Norte
95%
Dakota del Norte
50%
Ohio
6%
Oklahoma
50%
Oregón
95%
Pensilvania
5%
Carolina del Sur
25%
Dakota del Sur
50%
Tennessee
27%
Texas
95%
Utah
50%
Virginia
7%
Washington
7%
Virginia Occidental
5%
Wisconsin
6%
Wyoming
7%
$799 Vol.
Alabama
4%
Arizona
4%
Arkansas
96%
California
5%
Colorado
87%
Delaware
4%
Florida
25%
Georgia
50%
Idaho
96%
Illinois
4%
Indiana
5%
Iowa
5%
Kansas
5%
Kentucky
5%
Luisiana
6%
Maryland
26%
Minnesota
50%
Misisipi
94%
Missouri
26%
Montana
50%
Nebraska
94%
Nevada
95%
Nueva Jersey
46%
Nuevo México
95%
Carolina del Norte
95%
Dakota del Norte
50%
Ohio
6%
Oklahoma
50%
Oregón
95%
Pensilvania
5%
Carolina del Sur
25%
Dakota del Sur
50%
Tennessee
27%
Texas
95%
Utah
50%
Virginia
7%
Washington
7%
Virginia Occidental
5%
Wisconsin
6%
Wyoming
7%
D4 area below 0.05% is treated as cartographic noise at state borders and resolves "No".
Alabama carries a market in May through November, so this market exists for the week valid September 8, 2026. Weeks outside that window have no Alabama market and make no claim about Alabama's drought.
Each USDM release covers the seven-day period ending Tuesday at 8:00 AM ET and is published the following Thursday.
Resolution is based on the first published US Drought Monitor release for the listed week. Subsequent revisions will not be considered; the first published release is final.
The resolution source for this market is the US Drought Monitor at droughtmonitor.unl.edu.
Mercado abierto: Sep 3, 2026, 9:00 AM ET
Fuente de resolución
https://droughtmonitor.unl.edu/DmData/DataTables.aspxResolver
0x65070BE91...D4 area below 0.05% is treated as cartographic noise at state borders and resolves "No".
Alabama carries a market in May through November, so this market exists for the week valid September 8, 2026. Weeks outside that window have no Alabama market and make no claim about Alabama's drought.
Each USDM release covers the seven-day period ending Tuesday at 8:00 AM ET and is published the following Thursday.
Resolution is based on the first published US Drought Monitor release for the listed week. Subsequent revisions will not be considered; the first published release is final.
The resolution source for this market is the US Drought Monitor at droughtmonitor.unl.edu.
Fuente de resolución
https://droughtmonitor.unl.edu/DmData/DataTables.aspxResolver
0x65070BE91...Recent U.S. Drought Monitor data valid September 1, 2026, show exceptional (D4) drought covering about 1.4% of the contiguous United States, concentrated in Texas (2.6% of state area) and expanding across parts of the Northwest, including southern Idaho and eastern Oregon. Degradations over the past week in the Southern Plains and Upper Midwest, driven by persistent dryness and below-normal precipitation, have supported these conditions, while scattered improvements occurred elsewhere. El Niño influences and seasonal outlooks favor continued drought persistence in affected regions through fall. The next USDM map, released September 10 and valid around September 8, along with the updated Seasonal Drought Outlook on September 17, will provide key data for resolution, with model consensus on steering patterns and rainfall deficits as primary variables.
Resumen experimental generado por IA con datos de Polymarket. Esto no es asesoramiento de trading y no influye en cómo se resuelve este mercado. · Actualizado
Cuidado con los enlaces externos.
Cuidado con los enlaces externos.
Preguntas frecuentes