Meteorological conditions on August 22, 2026, are shaped by typical late-summer patterns of daytime heating, atmospheric instability, and available moisture that favor scattered convective showers and thunderstorms, especially across the Midwest and eastern U.S. NOAA’s Weather Prediction Center short-range guidance highlights localized lift from weak low-pressure areas and frontal boundaries, with precipitation probabilities tied to model consensus on moisture transport and convective available potential energy. Pacific systems such as Tropical Storm Moke exert minimal influence on the contiguous U.S., consistent with the below-normal Atlantic hurricane season outlook. Traders monitor real-time updates from NWS radar, satellite observations, and successive model runs for shifts in storm tracks or intensity that could alter rainfall distribution across specific regions before resolution.
Experimental AI-generated summary referencing Polymarket data. This is not trading advice and plays no role in how this market resolves. · UpdatedWhere will it rain on August 22?
Where will it rain on August 22?

New York, NY
29%

Los Angeles, CA
3%

Chicago, IL
52%

Houston, TX
4%

Dallas, TX
7%

Phoenix, AZ
5%
Philadelphia, PA
99%

Denver, CO
50%
Washington, DC
98%

Atlanta, GA
4%
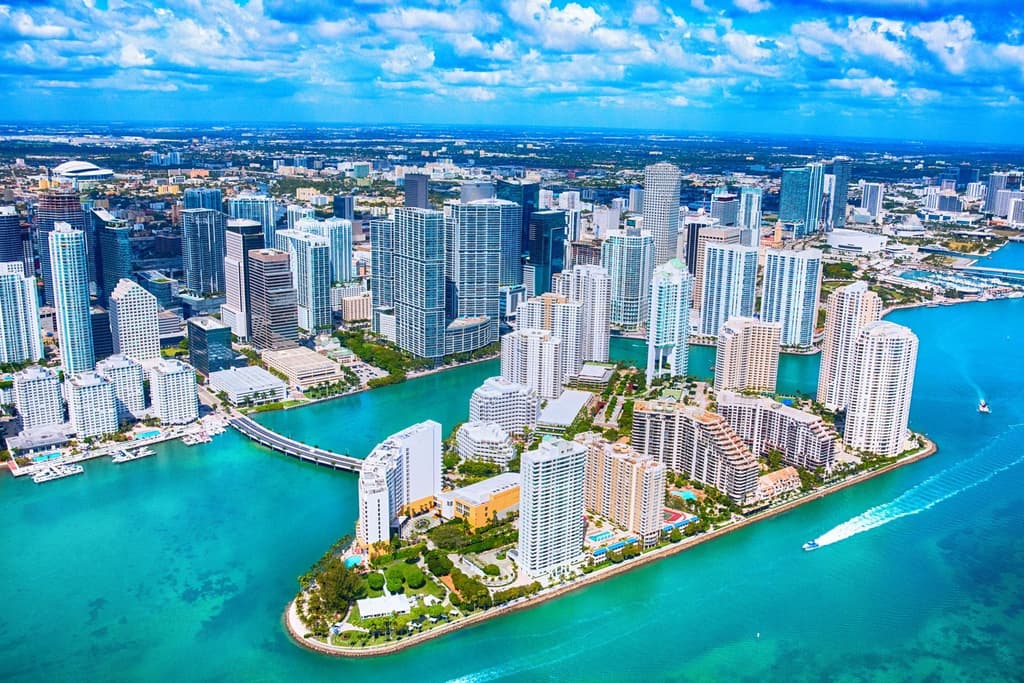
Miami, FL
50%

Seattle, WA
6%
Boston, MA
50%
New Orleans, LA
51%

San Francisco, CA
6%
$470 Vol.
New York, NY
29%
Los Angeles, CA
3%
Chicago, IL
52%
Houston, TX
4%
Dallas, TX
7%
Phoenix, AZ
5%
Philadelphia, PA
99%
Denver, CO
50%
Washington, DC
98%
Atlanta, GA
4%
Miami, FL
50%
Seattle, WA
6%
Boston, MA
50%
New Orleans, LA
51%
San Francisco, CA
6%
Measurable precipitation means 0.01 inches or more as reported by the PRECIPITATION (IN) figure in the NWS Daily Climate Report (CLI) for the city's station.
A report of trace ("T") does not qualify.
The PRECIPITATION (IN) figure measures total liquid-equivalent precipitation and does not distinguish between precipitation types.
The observation period is the NWS climate day for KNYC: midnight to midnight local standard time. The final CLI report for a climate day is issued the following morning.
Resolution is based on the station's first published precipitation figure for the day. Subsequent revisions or corrections to the published data will not be considered; the first published value is final. If no figure has been published by 11:59 PM ET on the day following the observation date, this market will resolve to "No".
The resolution source for this market is the NWS Daily Climate Report (CLI) for KNYC.
Market Opened: Aug 22, 2026, 7:09 AM ET
Measurable precipitation means 0.01 inches or more as reported by the PRECIPITATION (IN) figure in the NWS Daily Climate Report (CLI) for the city's station.
A report of trace ("T") does not qualify.
The PRECIPITATION (IN) figure measures total liquid-equivalent precipitation and does not distinguish between precipitation types.
The observation period is the NWS climate day for KNYC: midnight to midnight local standard time. The final CLI report for a climate day is issued the following morning.
Resolution is based on the station's first published precipitation figure for the day. Subsequent revisions or corrections to the published data will not be considered; the first published value is final. If no figure has been published by 11:59 PM ET on the day following the observation date, this market will resolve to "No".
The resolution source for this market is the NWS Daily Climate Report (CLI) for KNYC.
Meteorological conditions on August 22, 2026, are shaped by typical late-summer patterns of daytime heating, atmospheric instability, and available moisture that favor scattered convective showers and thunderstorms, especially across the Midwest and eastern U.S. NOAA’s Weather Prediction Center short-range guidance highlights localized lift from weak low-pressure areas and frontal boundaries, with precipitation probabilities tied to model consensus on moisture transport and convective available potential energy. Pacific systems such as Tropical Storm Moke exert minimal influence on the contiguous U.S., consistent with the below-normal Atlantic hurricane season outlook. Traders monitor real-time updates from NWS radar, satellite observations, and successive model runs for shifts in storm tracks or intensity that could alter rainfall distribution across specific regions before resolution.
Experimental AI-generated summary referencing Polymarket data. This is not trading advice and plays no role in how this market resolves. · Updated

Beware of external links.
Beware of external links.
Frequently Asked Questions